DataStudio
Tables
Data> Optional metrics
Adding other metrics hidden by default. You can select/deselect them by clicking on the bar icon at the top right of the table.
Data > Interactions > Apply filter
When clicking a row in the table, a filter will be applied to all the data
Conditional Formatting (Style > Metrics)
- Heat map
- Bar pub/sub
- conditiona formatting (custom)
Comparison Calculations
Data > Metric > <selected metrics> > Edit > Comparison Calculation
Some optons:
- Percent of total
- Difference from total
- Percent difference from total: how much data is different from the total in %
- Percentage of max: how much data is different from the highest value in its range in %
- Difference from max
- Percentage difference from max
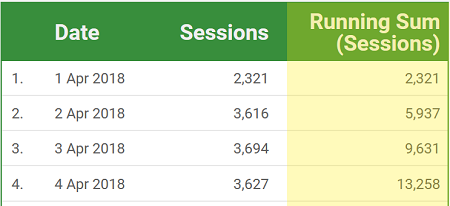
Running Calculations
Data > Metric > <selected metrics> > Edit > Running Calculation
Also called "Running summaries"
Running sum
Each new row is added to the sum of the previous row(s).
Creating custom calculation fields
Resources > Manage added resources > <row of the desired source> > edit > Add field
You need to add a field name and write the formula using existent fields.
Case statement can also be used
Comparison Date Range
Data > Comparison Date Range

Extract data
Data Source > Extract Data Improves the performance of reports and explorations by extracting data from your data set creating a brand new table.
Can use existing data sources of any type, then select the specific fields you want to include in the extracted data source.
Can set an Auto-Update
Extracting data from an already aggregated data set, such as Google Ads or Analytics, creates a new, disaggregated data set.
Charts
Drill Down
A way to reveal additional levels of detail within a chart by clicking on arrows on the top of the tables.
ex. time series in the order of years, can be drilled down into months
Geographics Chart
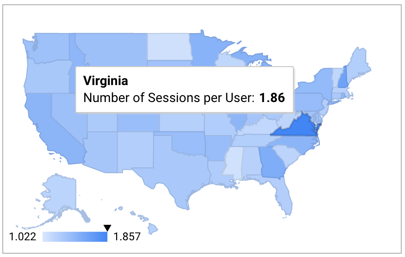
Different chart styles can be set according to the metrics.
Also the map can be customized: map/satellite, roads, landmarks, labels
Metric sliders
Metrics > Metric sliders
A filter can be applied via slider by clicking on the settings icon on the top right of the chart.
Custom Visualizations
Caution: